Modular Architecture
Pay for what you use. Enable what you need.
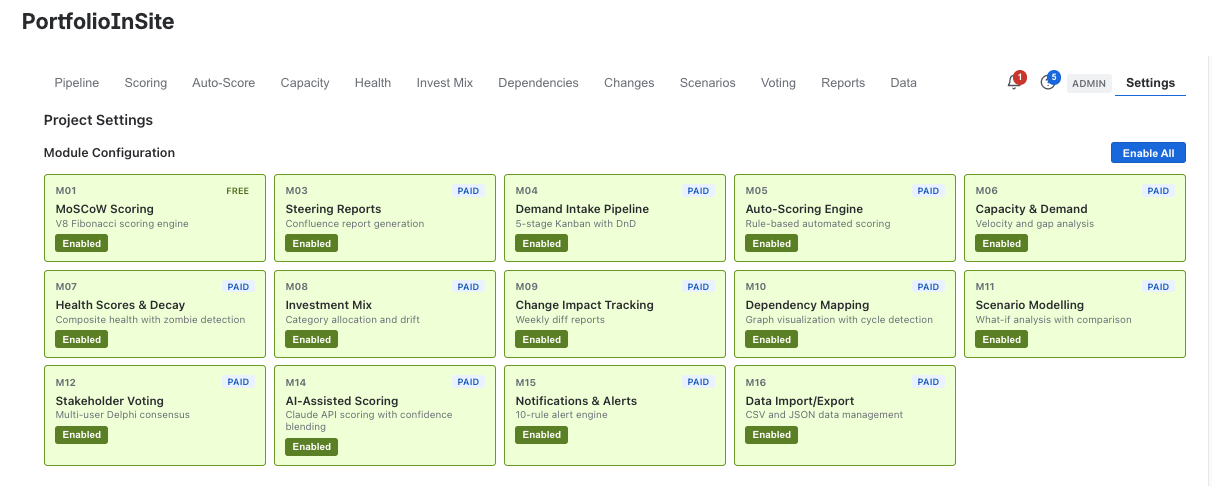
PortfolioInSite isn't a monolithic tool — it's 19 purpose-built modules across 5 build phases. Start with free MoSCoW scoring. Add paid modules as your governance maturity grows. No all-or-nothing licensing.
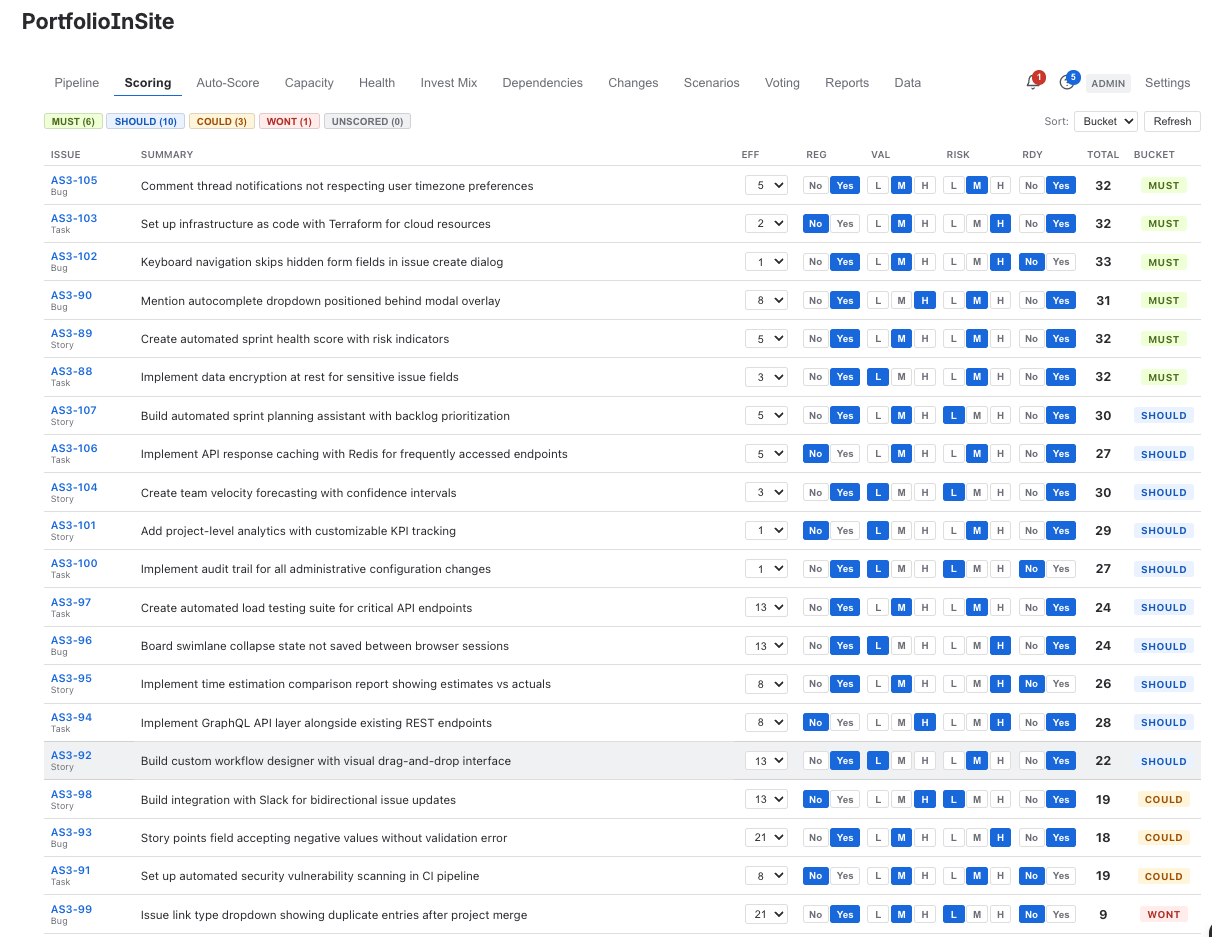
- M01 MoSCoW Scoring — free forever
- 13 paid modules across governance, intelligence, and reporting
- Enable or disable per project
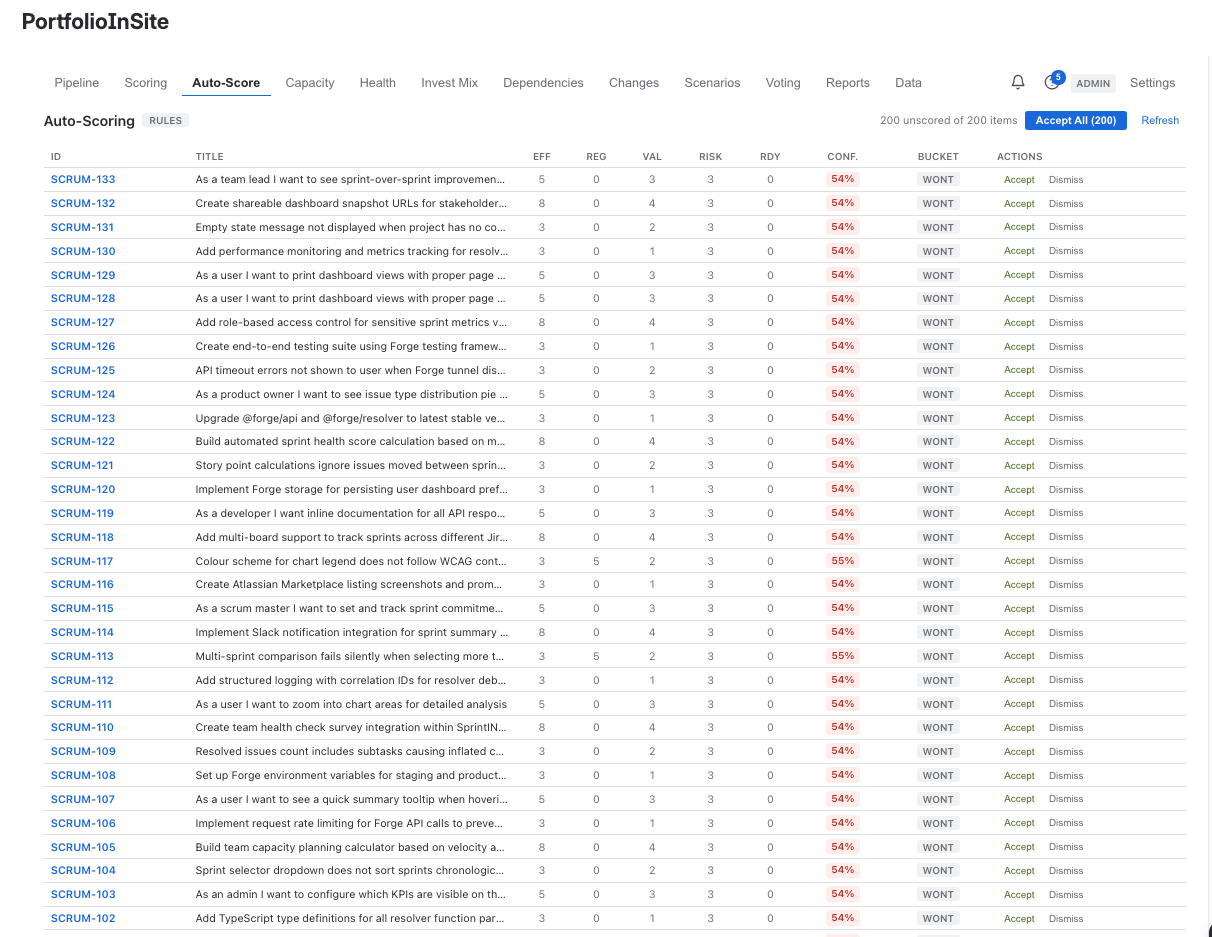
- Auto-Scoring method: Rule-based or Claude API